
Mature couple doing family finances at home. Senior couple discussing home economics sitting at … [+]
I recently illustrated the dangers of trusting the Dividend Aristocrats to take care of your retirement needs. Their average yield of 2.4% is a fraction of what you’ll need to retire on dividend income alone, and their payout growth—while long-standing—isn’t rapid enough to get you where you need to be when it’s time to call it a career.
Now here’s another problem with even the highest-yielding Dividend Aristocrats. Stick with me as we solve it and tap into $4,424 in dividend cash each and every month.
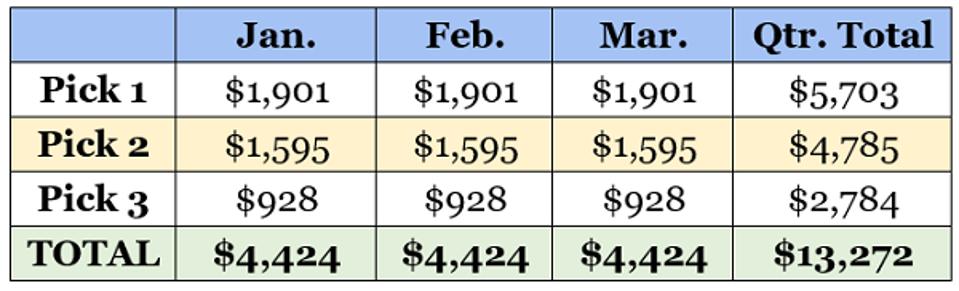
Here’s a look at the income schedule for an investor who sinks $100,000 evenly into the five highest-yielding Dividend Aristocrats. That’s AbbVie (ABBV), AT&T (T), Exxon Mobil (XOM), People’s United Financial (PBCT) and Chevron (CVX):

Contrarian Outlook
Something’s missing. Where is our January dividend income?!
The Dividend Aristocrats—and most blue-chip dividend stocks, for that matter—are quarterly payers. The problem? I don’t know about you, but I pay my mortgage monthly. The same goes for my electric bill, natural gas, phone, internet, you name it.
You could try to cobble together a portfolio of dividend stocks that will provide you roughly the same amount of income every month. Or you could try to partition every second-month’s oversized payout so that some income goes toward the first month of the second quarter, and… well, let’s just stop the nonsense there.
It’d be much easier and profitable to simply rely on monthly dividend stocks. These are firms and funds that pay us every 30 days like clockwork.
Let’s discuss three income plays that mail out their checks every month. They’re a rare breed! Many monthly dividend stocks are in “special categories” such as real estate investment trusts (REITs), closed-end funds (CEFs) and the like.
We can set regular monthly income by taking a detour from Wall Street’s self-serving recommendations (buy the stocks of the companies that hire us, they say.) And just look at the high-horsepower dividends they can deliver each and every month:
Contrarian Outlook
Here are three every-30-day payers that yield between 5.8% and 13.4%:
Vermilion Energy (VET)
Dividend Yield: 13.4%
Canadian energy producer Vermilion Energy (VET) isn’t going to show up on many investors’ radar. Unless they’re searching for yield, that is.
It’s an interesting company, especially geographically. While many smaller U.S.-traded E&P companies tend to focus on one or two areas of North America, Vermillion’s operations include:
- Natural gas conventional resource plays in the U.S. and Canada,
- Natural gas opportunities in the Netherlands and Germany,
- Oil drilling and workover programs in France and Australia, and
- A 20% interest in an Ireland gas field.
The diversification is nice. But like many E&P companies, at the end of the day, there’s but one thing that matters … commodity prices.
That price plunge has had the benefit of driving Vermilion’s yield up to a gaudy 13.4%. And the company has more than kept its monthly dole intact despite its difficulties–it actually raised it by 7% in 2018.
But Vermilion is playing with fire. The company spent more on capital projects and dividends last year than funds from operations (FFO), a key metric that VET uses to monitor its sustainability. It’s set to be around 100% of that mark again this year. And all of this assumes Brent oil prices of $63.54 per barrel, and West Texas Intermediate oil prices of $56.58 per barrel. However, both oil prices have spent considerable chunks of the year underwater.
Also troubling is C$1.9 billion in long-term debt. This is worrisome compared to its C$35 million in cash.
Plus, this small company’s fate is tied to the ebb and flow of oil prices. The black goo is a bit too volatile for me to bet on.
Main Street Capital Corporation (MAIN)
Dividend Yield: 5.8%
Main Street Capital Corporation (MAIN) is the cream of a weak crop. I’m talking about business development companies (BDCs), which provide funding to small and midsize companies. We recently discussed why they are “paper payout tigers”:
“Sure, they pay their dividends–but they take the distributions out of their own net asset values (NAVs), which means their stock prices give back most (or all) of the payout. Which is pointless.”
As a result, the field is filled with disappointing returns and unreliable payouts.
But not Main Street.
Main Street, founded in the mid-1990s, has delivered financing to more than 200 private companies during its lifetime. It provides “one-stop” debt and equity capital–common equity, preferreds and various debt structures–for companies looking to either grow or transition. It typically invests $5 million to $75 million in companies with $10 million to $150 million in annual revenues, and $3 million to $20 million in EBITDA.
Its 70 portfolio companies include fruit processor California Splendor, trade journal specialist Gulf Publishing Company and prepaid debit card solutions provider UniRush.
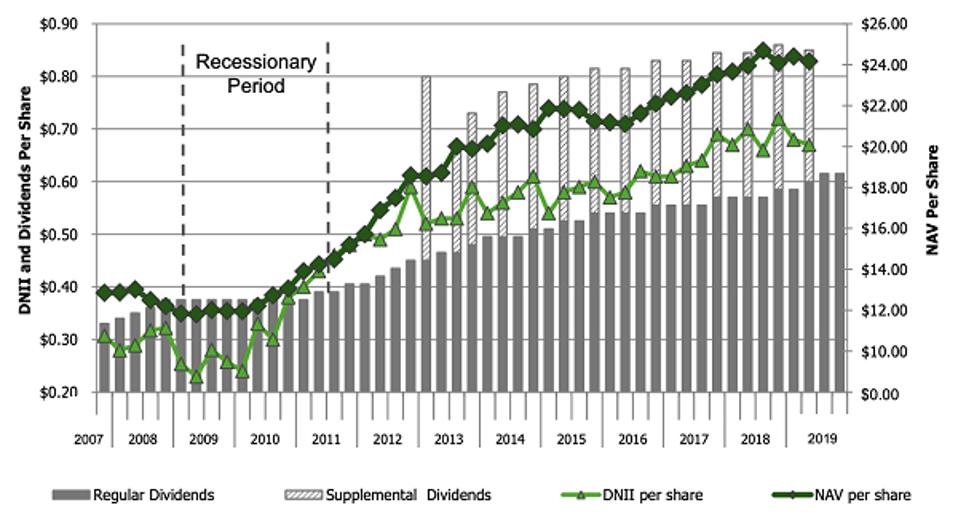
Discriminating management and conservative management have resulted in a track record that few other BDCs can boast. MAIN’s net asset value (NAV) and distributable net investment income (DNII) are in a long-term uptrend, and the company has never cut its monthly dividend.
Why MAIN is the Best BDC
Main Street Capital
Problem is, many income investors know that MAIN is the best. It’s the most expensive BDC on the market, at 1.79 times NAV. The next closest BDCs are Newtek Business Services Corporation (NEWT, 1.43x) and Hercules Technology Growth Capital (HTGC, 1.30x).
Depending on the circumstance, that could be excusable. Main Street typically trades at a high price-to-NAV. But it has only traded at this plump a valuation a couple times in the past dozen years or so. Better to wait for the inevitable pullback.
Guggenheim Strategic Opportunities Fund (GOF)
Dividend Yield: 11.5%
The Guggenheim Strategic Opportunities Fund (GOF) is a closed-end fund (CEF) with a strong claim at the moment: It has gone toe-to-toe with the S&P 500, on a total-return basis, over the past decade—and it’s a fixed-income fund.
A quick look at the innards: GOF’s managers use a mix of quantitative and qualitative analysis to identify undervalued debt securities. While it can hold alternatives and even equities, it’s predominantly a fixed-income fund. Right now, 39% of the portfolio is invested in bank loans, followed by asset-backed securities (18%) and foreign government and agency debt (11%), and pepperings of numerous other debt types.
The result is an excellent track record: an 11.5% average annual return since inception in July 2007 that’s the envy of its competition.
Near-term is another story. Its returns over the trailing three- and five-year periods aren’t nearly as strong, and its NAV has been on the decline for about two years now.
Despite that, GOF remains a terribly pricey fund. It trades at a 10%-plus premium to its net asset value, which is bloated even when compared to its five-year average premium of about 6%.
It’s a quality fund, but at a 10% premium investors are shelling over $1.10 for just $1 in assets. This is a violation of CEF investing rule number 7: always demand a discount.
Brett Owens is chief investment strategist for Contrarian Outlook. For more great income ideas, click here for his latest report How To Live Off $500,000 Forever: 9 Diversified Plays For 7%+ Income.
Disclosure: none